Infor recently announced the availability of Infor Hospitality Management Solution (HMS) version 3.8.4 – the latest release of the fully cloud-enabled hotel management software in the Infor Hospitality suite of solutions. Version 3.8.4 is focused on providing new options for optimizing and delivering personalized services. Per the press release, guests in this version are empowered to manage their check-in and check-out experiences according to preference—often en route and on their phones, requiring minimal contact with hotel staff. This property management system (PMS) functionality helps start and end a hotel stay with convenience, clarity, and care. Further, the focal feature of this release is the newest module, Upsell, which presents enhanced experiences and/or upgraded rooms at check-in. The parameters can be set such that the offers differ by guest type, allowing hoteliers to choose which of their guests will receive upgrade offers. Upselling can drive revenue for the hotel by providing higher average daily rate (ADR)/revenue, higher experience spends for special offerings, and boost guest satisfaction. Version 3.8.4 is available in English, German, French, Spanish, Simplified Chinese, Arabic, and Japanese, allowing Infor’s global customers to immediately benefit from the new features and interfaces.
Maintenance Service Plans (MSP)s provide managed services to deploy the basic infrastructure and application services. Subscription terms for managed services vary from month to month and can be paid upfront or monthly. Sources: 4
Depending on the size of your business and its needs, you can outsource a single service to a third party (MSP) or opt for an integrated and comprehensive range of services. An MSP is a third-party partner that companies, executives and business leaders provide for certain parts of their business, such as the cloud, IT, projects and support. Using an MSP to manage certain parts of the business can be a cost-effective alternative. Sources: 4, 5
You need MSPs who have the flexibility to take on additional projects and services as needed, and the ability to guide you in looking at new technologies. When selecting the MSP, you should assess your company’s compatibility with the MSP in matters such as compliance, service level agreements and data protection. Sources: 2, 9
Your MSP should be able to explain security practices of your data center and tell you how data is stored and which external providers use it. The right MSP will want to find out if you need certain features and specifications to manage your workload. You will also want to know if you need certain resources from your cloud provider. Sources: 3, 9
Managed services are now one of the fastest growing sectors of the enterprise technology landscape. Many companies are beginning to turn to MSPs for help. Accountancy firms, law firms, professional service organizations and small and medium-sized enterprises of all shapes, areas and markets are increasingly turning to MSPs for IT security, data management, 24 / 7 system monitoring and a variety of IT services for businesses. Sources: 3, 9
MSPs give your company flexibility and access to a dedicated, qualified IT team and their internal resources. MSPs have economies of scale on their side, which allows them to charge less for basic IT services and offer a wider range of expertise. Sources: 6, 9
Choosing the right MSP can give your internal IT team the most valuable time and reduce stress for business owners by establishing a clear SLA on how to handle and escalate issues. An MSP can manage your cloud on demand and ensure that your other critical IT infrastructure works smoothly. Sources: 6
If your company chooses the wrong MSP, you will be left with inexplicable downtime, reputation damage and dissatisfied customers. Cloud Managed Service Providers you select do not have the skills and experience required for this task, and the time and money you invest in them is a waste of time. Sources: 6, 7
For a tech-savvy company, assessing a managed service can be a complicated and challenging undertaking. There are many factors to consider when deciding to hire an MSP to meet your MSP needs, from vendor prices to contract terms. The expertise of your MSP can affect the efficiency, availability and outcome of your business and help you stay ahead of your competitors. Sources: 4, 7
To make the right decision about an MSP you must ask dozens of questions. Before entrusting your data to an MSP, ask about the challenges they have overcome in the past. Sources: 10
You want a provider who has demonstrated competence and interest in managing standards and workload in emergencies, complex problems and mission-critical systems. A managed service provider should be able to provide support in situations where it is not possible to use it. Sources: 2, 10
This means that MSPs should support a variety of virtual machine deployments, a variety of network connections and understand the specifics of working with different cloud service providers. Managed cloud service providers can serve a combination of MSPs and cloud service providers and should be equipped to manage hybrid cloud deployments. Sources: 2
An MSP is an outsourcing company that is responsible for defining and establishing day-to-day management of services for its customers. The central principle of the MSP model is that the provider-customer relationship is based on a contract that is secured by a Service Level Agreement (SLA). Applied to MSPs, the definition varies and changes depending on the service offered. Sources: 2, 4, 8
It is a strategic method of improving business operations that is common among large corporations, small and medium-sized enterprises, non-profit organizations and governments. An MSP can handle a myriad of operational tasks that are crucial to the success of a company, both for non-customers and for customers. This allows a company to leverage the skills and experience of an MSP while avoiding the direct costs of managing the program itself. Sources: 8
Deciding who to trust with the entire scope of your business can be daunting. In the modern age, companies live and die from the quality of technology and thus from the IT team that supports them. Sources: 0
This makes it all the more important to select the right MSP for your needs, qualifications and experience in order to take your company to a new level. In the information age, here are some tips and advice to help IT executives select a managed service provider and how to make the most of it. These tips will help boost your confidence and ensure that when you are looking for an MSP consultant for your business or IT, you get the best value for your money. Sources: 0, 1
It feels as if the term “managed service provider” (MSP) has existed since the dawn of computer technology. In short, a managed service provider is a company that outsources or manages parts of an organization through its platform. According to the 2017 IDC Application Services Survey, 30% of leaders outsource the management of their organizations’ infrastructure and application portfolios, which is expected to increase to 41% in the next five years. Sources: 1
Cited Sources
- https://techvera.com/choosing-the-right-managed-service-provider-msp/ 0
- https://www.information-age.com/essential-guide-managed-service-provider-123472938/ 1
- https://cloudian.com/guides/hybrid-it/managed-service-providers/ 2
- https://www.nortec.com/picking-the-right-managed-service-provider-in-5-easy-steps/ 3
- https://www.comptia.org/content/guides/comptia-buying-guide-for-managed-service 4
- https://pointivity.com/msp-checklist-choosing-the-right-managed-service-provider/ 5
- https://www.intercity.technology/blog/top-5-tips-choosing-msp 6
- https://nakatech.com/blog/cloud-managed-service-provider/ 7
- https://www.hcmworks.com/blog/what-is-a-managed-service-provider-msp 8
- https://www.taylored.com/blog/your-guide-to-choosing-a-managed-service-provider/ 9
- https://blog.pythian.com/8-questions-to-ask-when-choosing-a-database-managed-service-provider/ 10
Legal Notice The text provided on this site is based on and the intellectual property of the cited sources and ai-writer.com is not responsible for the content.
Often times, small companies use a number of off-the-shelf, cloud-based customer relationship management (CRM) applications right out of the box that needs no immediate customizations. While the features contained in this CRM system offer pretty much everything you need for your business, some of these applications aren’t made with growth in mind. While you still may not consider yourself a big business as your service grow, your CRM application does grow and will have bigger, more complex requirements to manage your data. Does this mean you have to find another CRM to replace your old one? Possibly, but not necessarily – especially if you do not want to throw down a lot of money. Gene Marks, CRM expert and former senior manager at KPMG shares an article on Forbes introducing the concept of low-code CRM. Put in simple terms, Marks defines low-code as a methodology for building software applications (almost always cloud-based) that use mostly pre-built tools, components and connectors. This reduces the need for a full time developer for the short term, though it is still important to have a reliable developer for the long term. Low-code platforms create apps of varying complexity to meet critical business demands such as development, process automation, and accelerated digital transformation. Companies such as Creatio have established themselves in the low-code CRM application market, offering their products and services to take away much of CRM’s complexity in small (and big) companies as a way to reduce costs. According to Gartner, the popularity of low code applications will result in 70 percent of new applications developed by enterprises will use low-code or no-code technologies, up from less than 25 percent in 2020. Marks concludes if you’re running a smaller business and need a customized CRM application, it’s important to consider the low-code offerings that your vendor may already have or look to other applications that offer these tools.
A vendor management system (VMS) is a suite of software that helps companies take over the entire vendor management process, from the first contact to the final conclusion of a deal or the establishment of a business relationship. Vendor management is a process that enables organizations to take appropriate measures to control costs, reduce potential risks associated with suppliers, ensure excellent service and derive long-term value from suppliers. Vendor management involves researching the best and most appropriate supplier sources, acquiring pricing information, assessing work quality, managing relationships (in some cases with multiple suppliers ), evaluating performance, establishing organizational standards and ensuring that payments are made on time. A supplier management system is an online or web-based tool that acts as a single node for all vendor-related activities within an organization or organization to ensure and improve efficiency and long-term growth in a cost-effective manner. Sources: 2, 6
With a modular approach, vendor management systems (VMS) have special modules or apps that handle processes such as vendor onboarding and vendor payments. Supplier management plays an important role in the operation of a supply chain, so there is a lot to consider when researching this type of software. It is the key to the success of procurement teams and the use of a good supplier management system offers advantages in this context. Sources: 2, 7
In this Buyers Guide, we explain the basics of vendor management software and what you need to know as a small business to make your software choices. Sources: 7
You should remember that the main objective of supplier management software is supplier engagement and maintenance as well as project management. However, many vendor management software systems offer much more, so you should carefully set your priorities when selecting a vendor management solution for your business. Sources: 0
When a company is looking for a new Vendor Management System (VMS), there are a variety of software solutions to choose from that appear to have similar functionality on the surface. Vendor management professionals would be well advised to devote more time to differentiating features such as native business intelligence (BI) and advanced workflow tools, with so much in common that leads to vendor sourcing to make the best buying decisions. It is curious that many vendor management software systems contain functions that could replace existing software solutions for your company. Sources: 0, 4
Next-generation VMS include BI capabilities such as the ability to analyze past performance, respond to business events in real time, and execute scenarios to identify future opportunities. The right vendor management software adapts to the existing legacy systems and increases the value of the operation. It streamlines your AP processes, creates self-service opportunities for vendors and facilitates communication. Sources: 4, 9
Choosing the right supplier management system is crucial to meet these growing requirements. By introducing appropriate supplier management, your organization benefits from a wider choice of suppliers, resulting in more choice and better costs. Let us examine some of the ways we need to look for when evaluating third-party providers and risk management solutions to make the implementation of your initiatives more cost-effective. Sources: 3, 6
The organization and management of vendor information such as financial contracts, insurance and certificates is crucial for effective third-party supervision. An efficient supplier management system ensures that the team works with suppliers in all functions and that there is complete transparency on important supplier details. Sources: 3, 10
A good supplier management system enables effective interactions between suppliers and their team leaders. Supplier management systems are software that helps companies manage their workers, suppliers, contractors and consultants. A good supplier management system is a great way to keep suppliers in your corporate culture and work environment. Supplier management software can help companies find subcontractors, contingent workers, and human resources agencies that are able to help with sales orders, consolidate billing, and reporting. Sources: 5, 9
Vendor management is a term that describes the process by which companies manage their suppliers, also known as vendors. Vendor management solutions are a kind of Software-as-a-Service (SaaS) that enables companies to communicate and assign tasks to paid independent contractors and freelancers. Sellers are involved through communication channels that facilitate real-time communication between sellers and strengthen relationships between sellers. Sources: 5, 9
Centralized and simplified communication tools that provide a secure and reliable way to approve and take suppliers on board, maintain useful performance monitoring and deliver the right analytics and insights to make critical business decisions. From an enterprise perspective, an efficient supplier management process can help save time and money, ensure that your organization works with reliable suppliers, and ensure contract compliance when drafting contracts, invoicing, making payments, and much more. Sources: 10
The supplier management system you choose should be compatible with your company’s existing tech stack without compromising your company’s data. Contact your IT compliance team to ensure that the solutions you evaluate work with the technology you already use, and that you trust the provider to protect your information. Sources: 11
Let your IT team know that you are considering some software solutions, and ask if there is anything special you can require from the vendor, such as an API (Application Programming Interface) that allows two different applications to communicate and work together. Now that we have set out why you need a supplier management system, let us discuss how it works. The first rule of thumb is that there should never be more than one vendor management system. Sources: 11, 12
Today, marketplace organizations depend on vendors and other third parties for essential business functions, making the maintenance of an effective supplier management program both important and complex. However, efficient supplier management results in both time and money savings, as it provides a way of keeping track of all of the important dates that need attention – expiring insurance certificates, for example. Sources: 3, 8
In the past, multiple supplier schedules and subsequent payments had to be managed on paper but today many companies opt for the supply chain management software that automates labor-intensive tasks. Many of the tasks above were previously done on paper and tracked manually, but more and more companies are now looking for vendor management software solutions such as web applications and cloud-based solutions that can handle most tasks. Depending on how companies scale, their supplier management software should be scalable and can be integrated into existing software. Sources: 1, 8
Cited Sources
- https://connecteam.com/top-12-vendor-management-software-solutions-for-2017/ 0
- https://www.smartsheet.com/how-to-choose-vendor-management-software 1
- https://kissflow.com/procurement/vendor-management/guide-to-vendor-management-system/ 2
- https://quantivate.com/blog/vendor-management-system-features/ 3
- https://www.cio.com/article/2427213/how-to-select-a-vendor-management-system.html 4
- https://www.stoketalent.com/blog/vendor-management-systems/ 5
- https://www.zycus.com/blog/supplier-management/a-complete-guide-to-vendor-management-its-benefits-challenges-process-best-practices.html 6
- https://www.softwareadvice.com/scm/vendor-management-system-comparison/ 7
- https://www.selecthub.com/supply-chain-management/vendor-management-software/ 8
- https://tipalti.com/vendor-management-solutions/ 9
- https://www.approve.com/blog/vendor-management/ 10
- https://www.negotiatus.com/blog/purchasing-tips/choosing-the-right-vendor-management-system/ 11
- https://www.venminder.com/blog/how-vendor-management-system-works-why-you-need 12
Legal Notice The text provided on this site is based on and the intellectual property of the cited sources and ai-writer.com is not responsible for the content.
When the global pandemic hit in 2020, there was a messy but necessary shift to remote work. How did companies handle the transitions with their employees on top of a stressful pandemic going on? It’s the same way a successful business would handle an employee on medical/extended leave or when businesses scale and a group of new hires need to get up to speed with current operations – workflow documentation. It doesn’t just ensure your organization doesn’t fall apart in a crisis, but it helps it thrive in good times and bad. Amy Rigby from Trello writes an informative article on why your team should invest time in workflow documentation.
Why is workflow documentation important for your business? Rigby breaks it down to 6 simple reasons:
- It Helps Optimize Processes
- It Ensures Accountability
- It takes The Confusion Out Of Employee Onboarding
- It Eases Merger Or Acquisition Transitions
- It Helps Scale Your Business
- It Safeguards Organizational Knowledge
These are solid reasons for documenting your workflows. Once understood, the real work begins. Rigby shares 4 easy steps to take:
Step 1: Define Desired Outcomes
“Once you’ve defined your team’s desired outcomes, you have a better idea of the workflows that need to be documented, and you’re ready for step two.”
Step 2: Carry Out And Capture Every Step Of Your Current Workflows
“Documenting the why behind a workflow is crucial. It helps with adoption and getting the buy-in from your team members.”
Step 3: Analyze Ways To Streamline And Automate
“In this step, analyze your workflow for opportunities to streamline and automate. The more you automate your workflow, the more time and energy you give back to your team so they can do more meaningful work.”
Step 4: Continue To Test And Refine
“Workflow documentation can and should change as your business grows and you better optimize your processes. With each new piece of feedback, you might decide to change a piece of your workflow. You might even experiment with different methods of documentation to achieve the best experience for your team.”
Workflow documentation does require a great deal of effort to run smoothly. But, as Rigby concludes, it makes for a more cohesive and productive team where everyone is always on the same page.
Original Post by Amy Rigby from Trello
Managed services are now one of the fastest growing sectors of the enterprise technology landscape. Many companies now turn to Managed Service Providers (MSPs) for help. MSPs have economies of scale on their side, allowing them to charge for basic IT services less and offer a wider range of expertise. Sources: 2, 9
In order to keep pace, optimize system performance and improve patient care, healthcare providers are increasingly working with MSPs. As managed IT services offer the right mix of security, scalability, reliability and flexibility needed to transform IT, healthcare organizations under pressure to maintain their own IT services on tight budgets are increasingly looking to these MSPs to manage some of their IT operations. Many healthcare providers take a “managed IT service” approach and work actively with these service providers. Sources: 7
If you do not have an IT department to manage your own technology, you can still benefit from hiring a (MSP). Whether you have your own IT department or not, companies are finding that they can save time and money and increase efficiency and effectiveness by signing contracts with an MSP to strengthen their existing IT staff.
Your business is special, your goals are important, your needs are important, and your MSP should treat you with the respect that your business deserves. You should never feel like you’re just another number in a new customer book of IT managed services providers.
Once you have interviewed a managed service provider, you should consider whether it offers traditional managed services or next-generation managed services. This is especially true for managed service providers who end up with complete administrative access to your entire network. The offerings will vary, but with next-generation database managed services providers, you can place greater emphasis on accessing strategic partners who can help you accompany your data journey, taking into account the mentality that traditional database management service providers offer. Sources: 5, 10
Your MSP is your IT protector, intermediary and Sherpa, grouped into an IT service provider that supports your business to the extent that suits your specific needs. Your MSP gives you access to remote support staff, infrastructure management, health monitoring, scheduled on or off-site support.
Here are some tips and advice for the information age to help IT executives choose a managed service provider and get the best out of them. It feels as if the term “managed service provider” (MSP) has existed since the dawn of computer technology. In short, a managed service provider is a company that outsources or manages parts of an organization to its platform. Sources: 1
MSPs are growing in popularity: according to the 2017 IDC Application Services Survey, 30% of managers outsource the management of their organizations “infrastructure and application portfolios, rising to 41% in the next five years. Sources: 1
Database-managed service providers, also known as MSPs, manage the technical infrastructure, databases and systems of customers. The services offered by an MSP include managed infrastructure, data and cybersecurity. As technology changes, database management service providers must have a wide range of resources at their disposal to develop their services and software to provide their customers with the best possible service. Sources: 10
In response, US hospitals may consider using services from an MSP as an MSP can help your institution recruit experienced clinical talent, simplify your work process and get an invoice from one contact. Many will present you with a list of services they can offer you at a price. Sources: 3, 6
Choosing the right MSP is not as simple as comparing the list of services they provide and going with the provider with the lowest cost. Gain an understanding of the MSPs of your organizations by evaluating your IT environment. Your MSP is more likely to see you as a partner, and your success will depend in part on you. Sources: 0, 6
A potential MSPs scope of business may not be as laser-focused as a top-tier MSP, and they may not deliver the focused attention and dedication your business deserves. An effective managed service provider is one that explores more information about your business, your needs, your challenges and your goals. An MSP needs to know who you are and where you want to go, from monitoring your technology to expanding your business. Sources: 0
Cited Sources
- https://www.elbo.net/post/9-tips-for-choosing-your-msp 0
- https://www.information-age.com/essential-guide-managed-service-provider-123472938/ 1
- https://www.taylored.com/blog/your-guide-to-choosing-a-managed-service-provider/ 2
- https://www.medicalsolutions.com/blog/client/client-services/what-is-a-healthcare-msp/ 3
- https://sbscyber.com/resources/choosing-a-managed-service-provider 5
- https://www.getgds.com/resources/blog/business-it/choose-managed-services-provider 6
- https://www.secure-24.com/blog/five-reasons-healthcare-providers-should-engage-managed-services-providers/ 7
- https://www.nortec.com/picking-the-right-managed-service-provider-in-5-easy-steps/ 9
- https://fortifieddata.com/what-to-look-for-in-a-database-managed-service-provider/ 10
Arena Flowers, a leading UK flower distribution service, has chosen Infor CloudSuite Distribution and multi-tenant cloud on Amazon Web Services (AWS),to help quickly and seamlessly scale the business in line with seasonal peaks in demand. During busy holidays such as Valentine’s Day and Mother’s Day, Arena Flowers can receive as many as a thousand orders within an hour through its systems. Per the press release, they were looking for a a solution that could cope with this level of complexity and shifting seasonal demands, maintaining the customer service excellence that the business is known for while delivering cost and efficiency savings across its operations. Infor CloudSuite Distribution will do just that. Implemented by Infor partner Harpyja Limited, the team is working both remotely and on site with Arena’s senior management and operations teams and was chosen to provide a consistently positive customer experience, optimizing processes to fulfil orders quickly and effectively, even during the busiest periods. Further, the solution’s cloud-based platform replaces an in-house developed system and will help result in a lower total cost of ownership (TCO) for Arena Flowers alongside the benefit of always having an up-to-date solution.
When attempting to access Lawson applications hosted in WebSphere, you may encounter a 500 service error that gives very little details. If there are no exceptions in any of the LAWDIR/system or WAS systemout.log, go you should also check the http_plugin.log in WAS/plugins/logs/<web_server>. If you discover GSK error message, this indicates that there is something wrong with your certificates or IBM security.
The error message will typically look like this:
[Thu Apr 01 09:47:45 2021] 00002574 000025a8 – ERROR: lib_stream: openStream: Failed in r_gsk_secure_soc_init: GSK_ERROR_BAD_CERT(gsk rc = 414) PARTNER CERTIFICATE DN=CN=test.company.com,OU=certs,O=company,L=anywhere,ST=California,C=US, Serial=2d:7b:d0:29:00:08:00:00:5e:22
[Thu Apr 01 09:47:45 2021] 00002574 000025a8 – ERROR: ws_common: websphereGetStream: Could not open stream
[Thu Apr 01 09:47:45 2021] 00002574 000025a8 – ERROR: lib_stream: openStream: Failed in r_gsk_secure_soc_init: GSK_ERROR_BAD_CERT(gsk rc = 414) PARTNER CERTIFICATE DN=CN=test.company.com,OU=certs,O=company,L=anywhere,ST=California,C=US, Serial=2d:7b:d0:29:00:08:00:00:5e:22
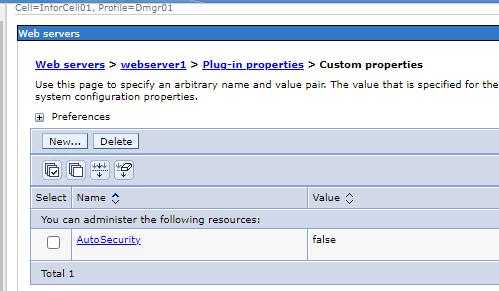
This can mean that the web server certificate is expired or invalid or not matching the certificate on the trust or key stores. Another thing to try is to set “AutoSecurity=false” on the Web Server plug-in custom properties.
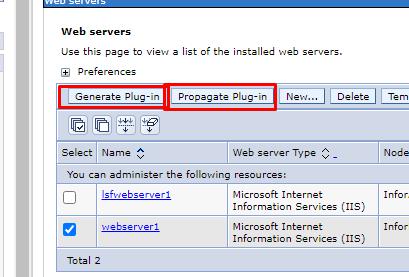
To do this, go to Web Servers > <web server> > Plug-in Properties > Custom properties. Create a new property. The Name is AutoSecurity and the value is “false”. Save the configuration, then generate and propagate the plugins. Make sure that the plugins xml file has the new “AutoSecurity” setting in it. Bounce the WWW Publishing services for the change to take effect and test your application again.
- Data In One Place. “One of the main reasons why CRMs exist is to help you consolidate data. Your leads, their contact information, their history with your company, key people in the company, interests — these all belong in one place, and this consolidation makes the sales job even easier. Once you strike a deal, be sure to immediately send an invoice from the CRM so that you don’t have to chase them through emails or some other communication method.”
- Revenue Analytics. “If you send invoices and get payments through your CRM, you can immediately know how many of your sales in the pipeline pay and how many of them fall through the cracks. This way, you’ll have a clear overview of which channels bring in the most conversions. Moreover, you’ll know if any invoices are outstanding and which customers aren’t paying up.”
- Time Savings. “As you probably know, before prospects become leads, they don’t get invoices — they get quotes. Consider a CRM that gives you the option of turning a quote into an invoice with one click. Moreover, keep in mind that you’ll be able to apply any special offers or discounts immediately from the CRM. If you have international customers, this part of the app will take care of different currencies and conversions, so you don’t have to worry about anything but selling.”
